


“False Rhenium, Real Germanium”: A New Risk in Gold Manufacturing
2025-11-25
 1825 348
1. The Challenge of Complex Structures
Coated samples are the most challenging types for XRF analysis.
When X-rays penetrate the surface of a coated sample, they excite fluorescent signals not only from the outermost layer but also from the underlying elements.
As a result, the spectrum of a multi-layer sample is different from that of a single-layer one, including the peak intensities, background, and even energy distribution.
That’s why conventional empirical algorithms often fail when faced with multi-layer structures: they can only fit an overall composition, without knowing which layer each signal comes from, or how thick each layer is.
2. How the FP Algorithm Identifies "Layer Structure"
The True FP Algorithm makes a breakthrough in multi-layer analysis.
During modeling, it considers each layer’s thickness, density, absorption coefficient, and elemental composition, simulating the excitation and attenuation of X-rays layer by layer.
By comparing subtle differences between the simulated and real spectra, the algorithm can determine:
· Whether the sample has a multi-layer structure;
· The thickness and composition of each layer;
· Which signals come from the surface and which come from the base metal;
A Real Example: Step-by-Step Spectral Reasoning
Let the FP algorithm analyze an unknown jewelry sample.
Step 1: We first test the sample with the K gold curve.
The simulated spectrum fails to match the real one—the deviation is significant.
This indicates that the sample likely has a multi-layer structure.
Step 2: We examine the characteristic peaks.
A strong silver peak suggests that there is silver in the base metal.
Given plating practices (multi-element coatings are uncommon), we can exclude the possibility of a multi-element coating such as gold–copper–palladium–zinc over silver.
Step 3:
Based on common jewelry structures, we hypothesize: base metal: pure silver → plated with palladium →plated with gold–copper–zinc alloy.
However, the simulated and real spectra still show misalignment in the silver and copper peaks—implying that both elements exist in different layers.
Step 4:
We refine the model to a more realistic structure: base metal: silver–copper–zinc alloy → plated with silver → plated with palladium → plated with gold–copper alloy.
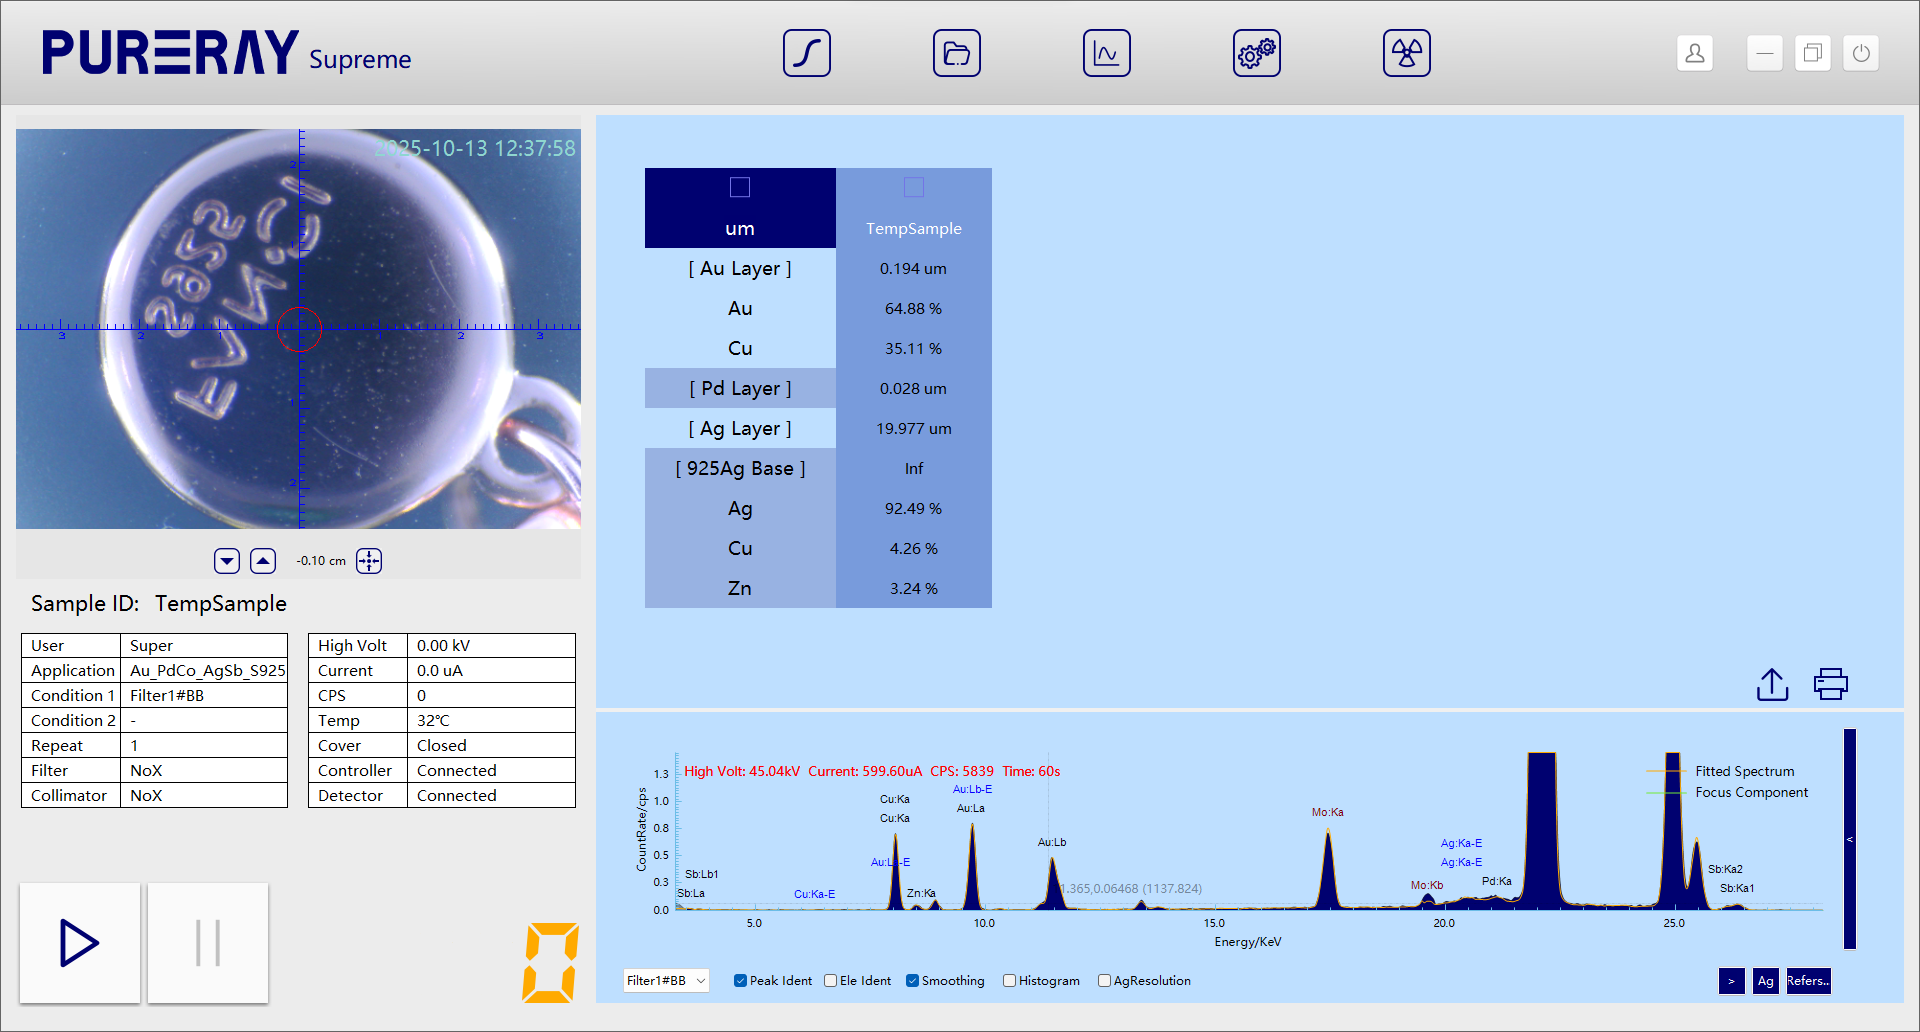
Now, the simulated FP spectrum perfectly matches the real one, confirming that our hypothesis fully corresponds to the actual structure.
3. A "Reverse Engineering" Process for Spectra
You can think of the True FP Algorithm as a form of spectral reverse engineering.
We input a hypothesized sample structure, and the algorithm simulates the theoretical spectrum.
It compares this with the real spectrum and keeps adjusting parameters. When the two spectra match perfectly, we not only know the composition, but also the structure of the sample.
Mathematically, this process is known as convergence; in engineering terms, it means “certainty”—a solution that can be verified and reproduced.
Please refer to Part 1 of this series for how FP’s simulated spectra gradually align with the real spectra from the first second to the thirtieth second.
4. Why Empirical Algorithms Can't Do This
An empirical algorithm is a simple mapping between peak intensity and composition. It does not consider layer thickness, absorption, energy loss and so on.
Even if the spectral shape changes, it can only output an average composition, without distinguishing coatings.
In contrast, the True FP Algorithm can "see through" coatings because it truly understands the physical laws behind the spectrum.
5. Conclusion
The True FP Algorithm measures composition and infers structure.
That is the scientific power behind its ability to see through everything.


Email:marketing@pureray.com
Tel:+852 55655728