


“False Rhenium, Real Germanium”: A New Risk in Gold Manufacturing
2025-11-25
 1824 353
1. Introduction: When a Customer Says “Silver Plated with K-Gold,” the Truth Is More Complex
In the jewelry and electroplating industries, the most common testing request is:
“Please check if this is silver plated with K-gold, and how thick the gold layer is.”
However, every testing engineer knows that behind this question often lies a much more complex electroplating structure. What is called “silver plated with K-gold” may actually contain multiple metal layers, diffusion barrier layers, or alloy layers.
For conventional XRF empirical algorithms, this is almost an “unsolvable problem.”
They can measure the gold, but they cannot understand the entire system.
Conventional algorithms rely on data fitting, not physical understanding.
The previous article “Applications of the True FP Algorithm in Precious Metal Testing” was a preliminary demonstration of FP's potential.
This article presents the real power of the True FP Algorithm in coating thickness detection.
Comparison Between Traditional Empirical Algorithm and the True FP Algorithm.
Comparison Dimension | Conventional Empirical Algorithm | True FP Algorithm |
Principle | Data fitting | Physical modeling |
Dependency | Calibration standards | X-ray physical equations |
Output | Numerical results | Composition + structure + spectrum fitting |
Unknown samples | Cannot analyze | Scientific inference, blind analysis solvable |
Physical consistency | Not verified | Automatically validates energy balance |
2. A Blind Sample: The Customer Only Told Us “Silver Plated with K-Gold”
A jewelry manufacturer sent a batch of samples and asked us for testing. The delivery note contained only four words:
“Silver plated with K-gold.”
The results from other brands of instruments were inconsistent with the data provided by the electroplating factory.
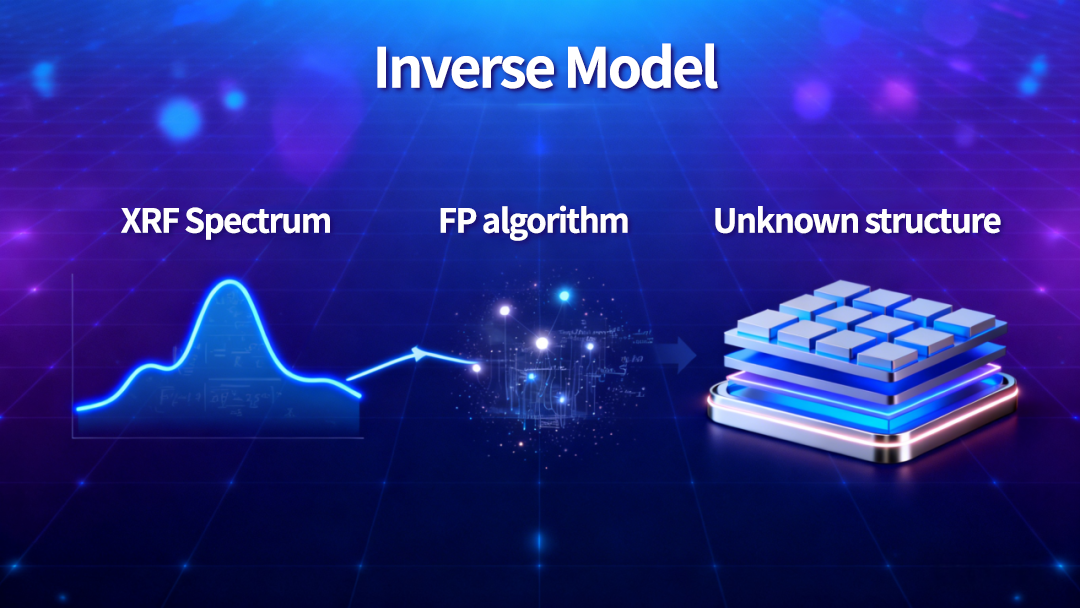
3. The True FP Algorithm in Action: The Algorithm “Deduces the Sample Structure”
We had no prior information — no number of layers, no composition, and no thickness reference.
We only know is K-gold plating on silver.
3.1 Selecting the AuAgX Alloy Curve for Preliminary Measurement

Initial testing results showed that the sample contained six elements: Au, Ag, Cu, Zn, Pd, and Sb. However, the fitted spectrum did not match the measured one, especially the Au:Lα and Au:Lβ peaks, which were clearly abnormal.
This indicated that the sample must be a multilayer coating structure.
3.2 Assuming a Two-Layer Structure
Layer | Composition | Thickness (µm) |
Surface | Au–Pd–Zn–Cu–Sb alloy | Unknown |
Substrate | Pure Ag | — |
The fitted and measured spectra still did not match.

3.3 Further Assumption
Layer | Composition | Thickness (µm) |
Surface | Au–Cu alloy | Unknown |
Second layer | Pure Pd | Unknown |
Substrate | Ag–Zn–Sb alloy | — |
 There was still a large discrepancy. The copper peaks were unusually high, suggesting that the substrate contained copper.
Considering industrial practices:
925 silver products typically have a pre-plated pure silver layer on the surface.
We then proposed a fourth hypothesis:
Layer | Composition | Thickness (µm) |
Surface | Au–Cu alloy | Unknown |
Second layer | Pure Pd | Unknown |
Third layer | Ag–Sb alloy | Unknown |
Substrate | Ag–Cu–Zn alloy | — |

Based on this model, the residual difference between the fitted and measured spectra was minimized, and the spectral shapes fully matched.
The element Sb could only achieve matching in the third layer, indicating that the “pure silver” layer contained trace Sb.
The final result was as follows:
Layer | Composition | Thickness (µm) | Physical Meaning |
Surface | Au 66.04%, Cu 33.95% | 0.33 | K-gold decorative layer |
Second layer | Pd 99.9% | 0.039 | Diffusion barrier layer |
Third layer | Ag 94.55%, Sb 5.44% | 9.308 | Pure silver layer (with Sb) |
Substrate | Ag 92.97%, Cu 4.0%, Zn 3.02% | — | 925 silver base material |
When we informed the customer of the results, their electroplating supplier was almost in disbelief:
“I only told you this was silver plated with K-gold — how did you know it was 925 silver with an additional silver layer, and even that the silver contained Sb?”
I smiled and replied:
“We didn't know — the algorithm deduced it itself.”
4. For Conventional XRF, This Sample Represents Four Major Testing Challenges
4.1 Alloy Coating
Even if the structure of the sample were known, conventional XRF would still face the “standard curve dilemma.”
For the top gold–copper alloy layer, the empirical algorithm would need to prepare multiple standards of varying thicknesses and compositions to approximate reality —
and still could not output thickness and composition simultaneously.
The empirical algorithm memorizes spectra, while the FP algorithm understands physics.
4.2 Signal Shielding in Multilayer Structures
The middle Pd layer acts as a “black hole” for signals.
Pd’s high X-ray absorption coefficient nearly completely masks the Zn peaks in the substrate.
Conventional algorithms output a falsely high gold layer thickness because they cannot identify such “intermediate shielding” structures.
The FP algorithm fully simulates photon excitation, absorption, and backscattering paths,
automatically recognizes the presence of the Pd layer.
Traditional algorithms see signals from two layers, while FP analyzes multiple layers.
4.3 Reasoning in Blind Sample Detection
Throughout the analysis, we tracked the change in residuals between fitted and measured spectra, and, combined with knowledge of precious metal plating processes, quickly deduced the four-layer structure.
Conventional algorithms require “experience”, while FP only requires “understanding.”
4.4 The “Silver and Copper Signal Mystery” of the Same Element Across Different Layers
The most striking part was that the spectrum showed two Ag:Kα peaks and two Cu:Kα peaks simultaneously.
The customer asked:
“Aren't they the same silver? Why are there two Ag Kα?”
Conventional algorithms can never explain this.
The FP algorithm's photon path model revealed the truth:
One silver signal originated from the substrate (direct excitation);
Another came from the upper silver layer (backscattering re-excitation).


Both silver and copper appeared in multiple layers: silver existed in the substrate and the third layer, and copper in the substrate and the first layer.
For empirical algorithms, it is impossible to distinguish the origins of these signals.
Conventional algorithms see a single peak, but FP understands two distinct paths.
After reviewing the report, the customer paused and said:
“The old instrument told me ‘this piece is gold plated,’ your algorithm tells me ‘how many layers it has, how thick each is, and what elements each contains.’”
5. Conclusion: One Test Solving Four Major Challenges
This single sample simultaneously verified four key breakthroughs of the True FP Algorithm in industrial coating detection:
Challenge | Conventional Algorithm | True FP Algorithm |
Alloy coating | Linear addition assumption incorrect | Nonlinear inter-excitation modeling |
Structures with 3+ layers | Signal shielding, identification failure | Path inversion, accurate layer resolution |
Blind sample detection | Cannot analyze unknown structures | Automatic convergence, structural reasoning |
Same element across layers | Signal overlap, misattributed origin | Path separation, independent identification |
The True FP Algorithm is not about “measuring accurately,” but about “understanding correctly.”
Pureray True FP Algorithm — One Test, Seeing All Layers.


Email:marketing@pureray.com
Tel:+852 55655728